There is little debate that employee attrition is costly, and most organizations take as an assumption that less attrition is better. But like any other business cost, investments to decrease employee attrition should be prepared to demonstrate an adequate return. This requires a clear view of the cost of attrition that is informed by more than basic benchmarks.
Read on for a full description of our methodology, or download a free Excel calculator to perform a custom calculation for your organization.
The market is flooded with benchmarks and guidelines:
- $1,500 per hourly worker
- 50% of pay for entry-level professional roles
- 100% of salary for technical positions
- 200% of salary for leadership positions
These benchmarks may be right - but often fall short when scrutinized by a CFO. It's unclear how much of the benchmark cost is a "hard cost" (actual dollars out the door), a "soft cost" (an assumed allocation of time spent by workers), or an "opportunity cost" (the value of work or outputs not produced because of the vacancy). Tough business decisions require a more customized view that can hold up to scrutiny, and in the case of employee attrition this requires a deeper view into the underlying drivers of cost.
For the purposes of this analysis and calculation, we assume that the attrition is voluntary (employee chose to leave) and regrettable (we would prefer they chose to stay). We also assume the intent will be to replace the worker. While we know these assumptions are not true for all leavers, it simplifies the view of what the cost/impact is of the attrition and resulting vacancy.
The cost of attrition can be broken down into five separate components:
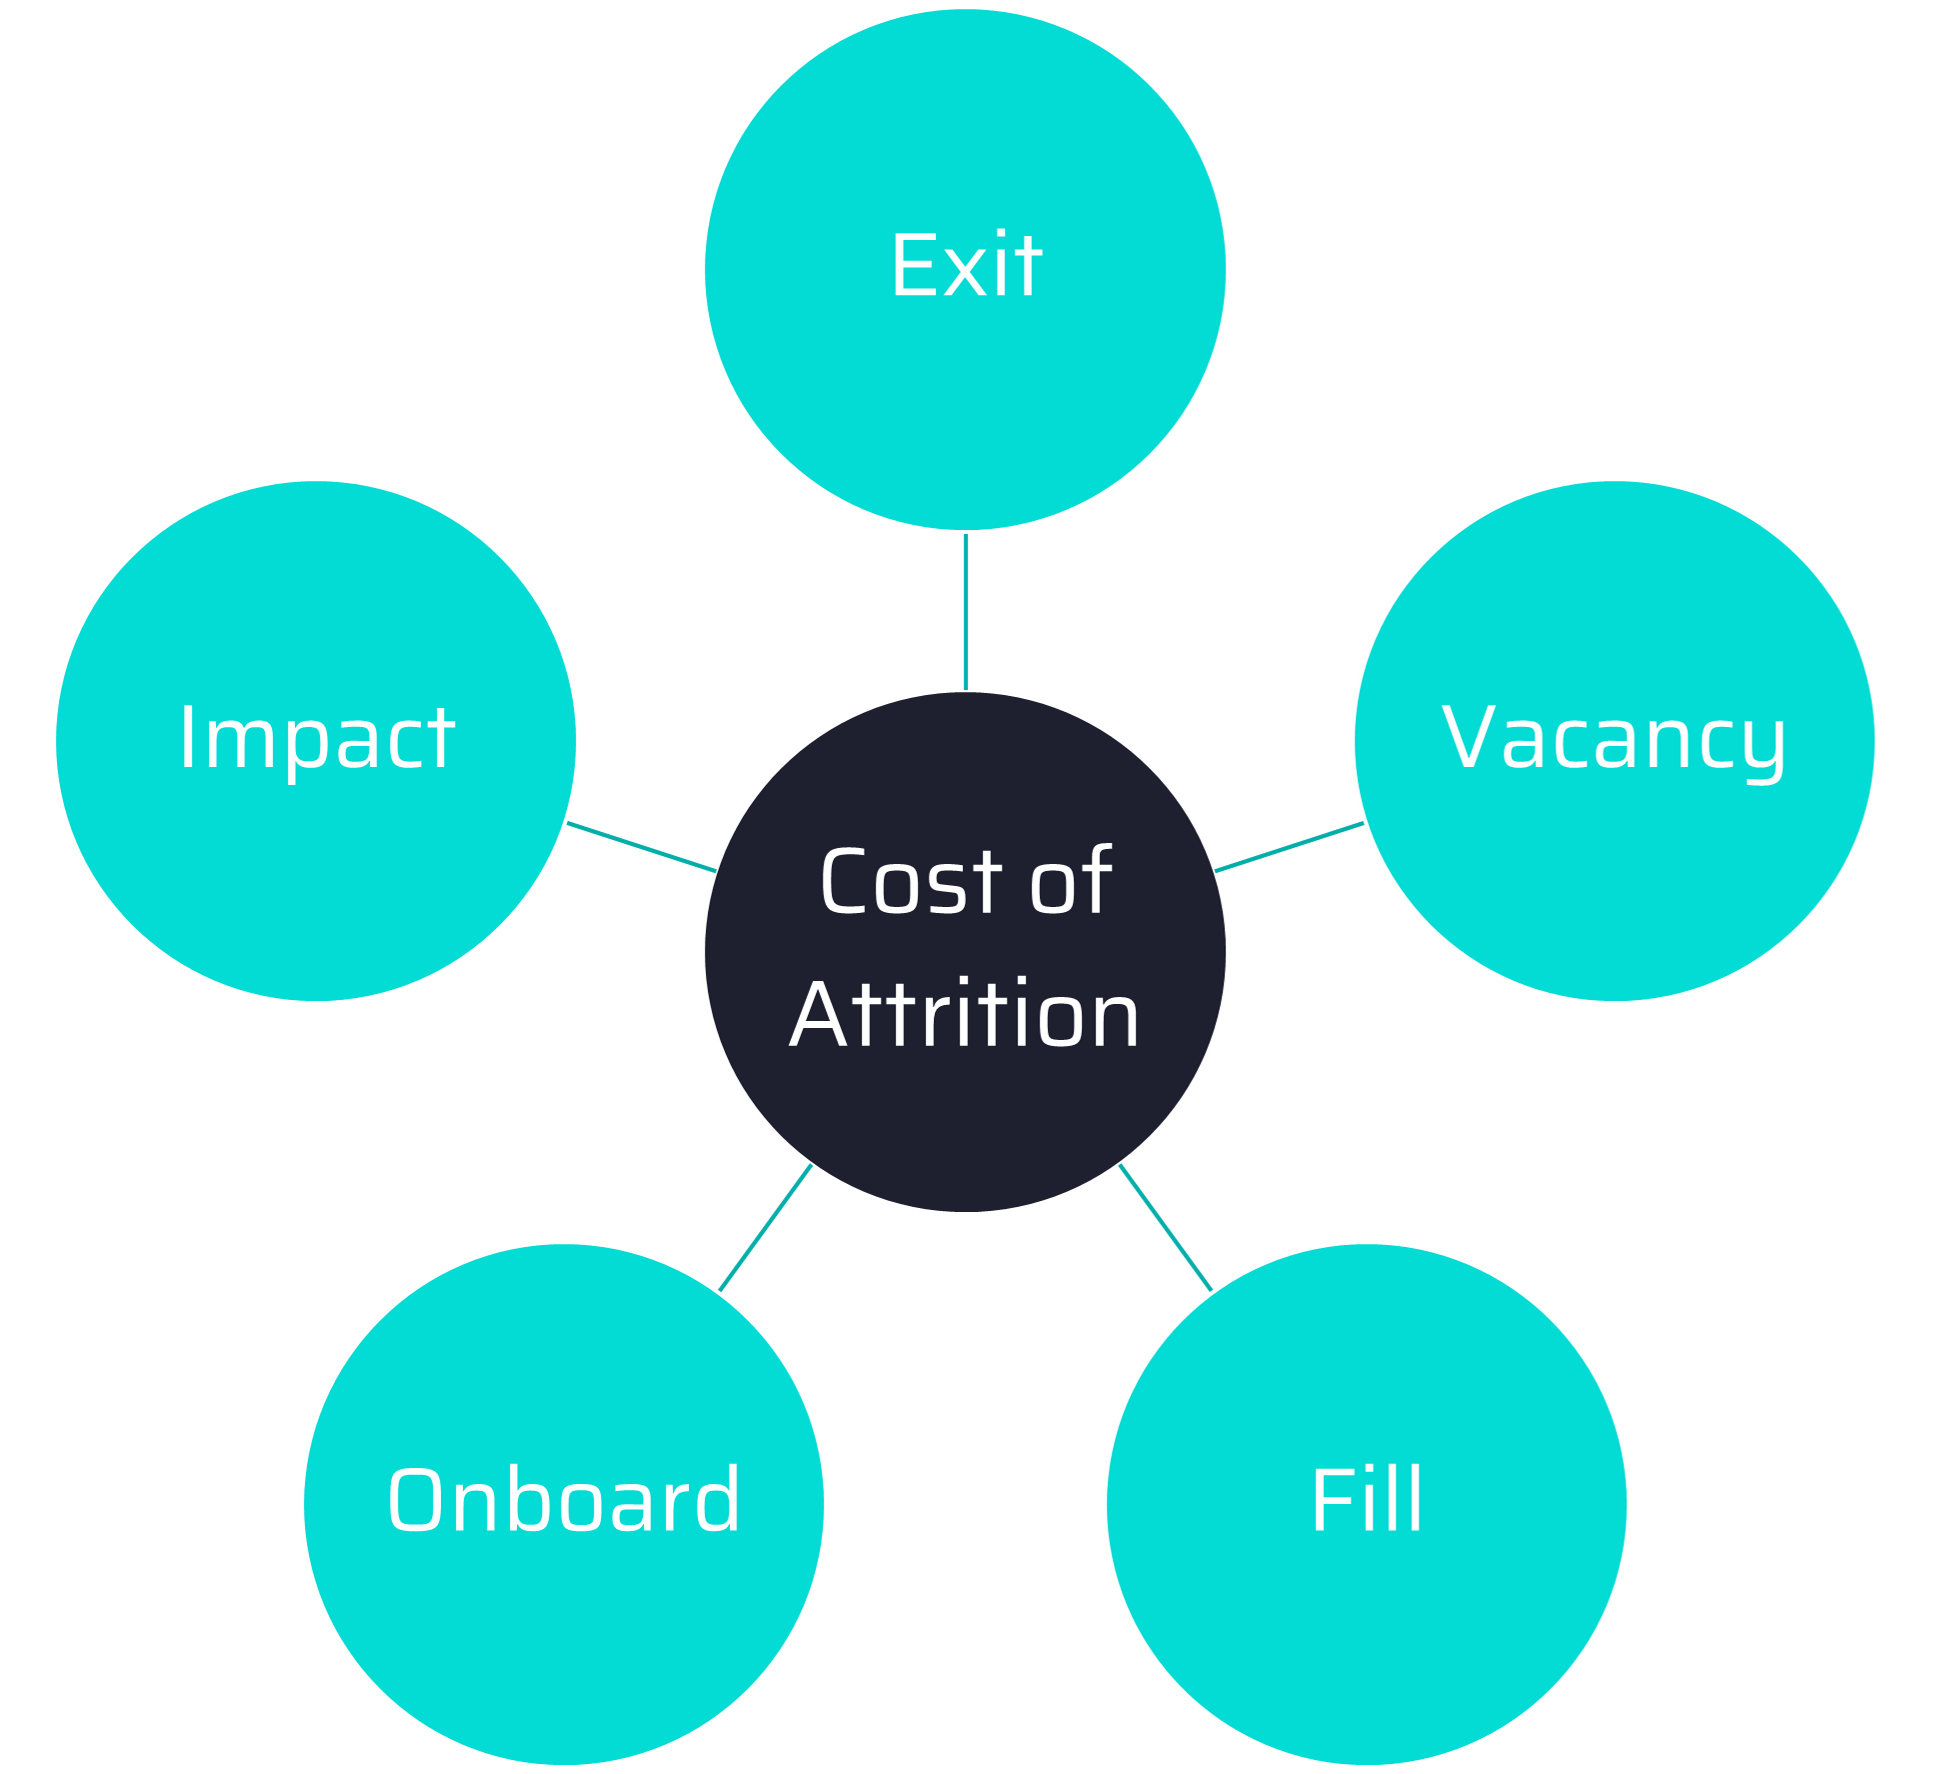
Each of the above components are further described below.
Cost of Exit
These costs are incurred based on the employee's direct departure. There is often a direct cost of each employee exit, as work must be done to facilitate the exit and expenses are incurred. Examples of this cost include the processing of the termination, conducting an exit survey/interview, the cost of the farewell party, and even just the simple processing of the COBRA paperwork.
These costs are typically fixed regardless of the type of worker, and thus make up a larger portion of the aggregate cost of attrition for lower wage / high attrition roles.
Cost of Vacancy
As the role sits vacant, an organization typically chooses one of two paths:
- Let it sit open. The underlying work of the role simply remains undone. In this path, costs are exclusively modeled opportunity costs. Examples include sales not delivered, slower delivery of revenue-generating products, or increased customer hold times that can lead to customer churn.
- Replace with temporary resources. The work is explicitly covered by a replacement (either from inside the company or outside the company) during the vacancy, and this work comes at a cost. Note that this can be done in a one-for-one manner (e.g., this contractor is covering for this departed worker) or by spreading the work around (e.g., having a manager cover). Added costs can come in the form or contractors, internal rotations, interim assignments, or increased overtime from others.
Note that in each of these strategies, the cost of the vacancy is offset by the gain associated with not paying the departing employee.
The cost of vacancy varies a lot by job function. Customer facing roles can show material opportunity costs, whereas task-based work that can be covered by contractors or gig workers often show no or even negative vacancy costs.
Cost to Fill
The hiring process is an expensive one, with a healthy mix of hard costs and soft costs. Hard costs include job advertising, agency fees, background checks, interviewing expenses, and technology costs for the recruitment team. Soft costs include time spent by the recruitment team processing and sourcing, or the time spent by managers during the selection process.
The cost of fill is much like the cost of exit, in that it tends to be relatively fixed by the worker type. Primary exceptions to this are when certain roles are more likely to incur agency fees.
Cost to Onboard
Once a new employee is hired, there are direct costs to facilitate onboarding. Examples of hard costs associated with onboarding include new hire swag, travel to an office as part of orientation, and any investment required in equipment or tools. Soft costs include time spent by managers an supporting teams to welcome and train the new employee.
In addition to the investment to onboard above, there is often an opportunity cost associated with decreased productivity of a newer employee. This cost typically mirrors the cost of vacancy, just to a lesser extent that diminishes over a period of time.
The cost to onboard varies considerably across job roles and functions.
Cost of Impact
When an employee leaves, it often affects the morale/productivity of others, which can lead to additional attrition. This is more difficult to quantify, as it is essentially an increase in the probability (but not certainty) that another attrition cycle will occur, with all of the associated costs from the other four components. This is relevant when you are looking to estimate the cost of a given attrition, but should be excluded when calculating an aggregate cost of attrition since those other leavers would be included in the calculation.
Doing the Math by Segment
The above components are difficult to factor into a simple benchmark, but a rule of thumb is attractive given the detailed nature of a full calculation. We recommend segmenting your job roles into groups with materially different cost drivers. For example, a call center role's cost to hire is different than an engineer, and a sales representatives cost of vacancy/onboard is very different than a corporate role. We then recommend developing a detailed calculation for each segment - not for every job role or job family within the segment, as the outcome is typically similar within a segment.
Ready to apply this to a segment of your organization? Click here to download a free Excel calculator to perform a custom calculation for your organization.