
Andrew, a respected senior sales leader, sends the email with a subject line that makes you squirm a bit. “Comp Benchmarks from Peers,” it reads. You know this either is going to create new work for your already stretched team, or it will lead to rounds of conversation about the relevance of the data he’s found online. Either way, you open it reluctantly.
Stacy –
See below for a representative set of OTE benchmarks from companies poaching our people. Our OTEs are well below standard. We used to be able to rely on telling people that OTE wasn’t relevant, since they would easily exceed quota, but that’s not true anymore as we've grown and shrunk territories. Something needs to be done or we will be out of business.
The specific facts may vary, but the story is all too familiar. As a compensation leader, you are caught on your heels by a set of data that suggests investment is needed, but you know that similar data is not hard to come by in almost any job group or geographic area. Compensation is certainly the predominant tool for organizations looking to attract and retain talent, and as such it’s a logical lever to pull when there is talent risk.
Data about compensation has never been more available than now, and clever approaches to sharing pay opportunities can create a distorted view. But in the absence of data that leaders can understand consistently and align upon, anecdotes and casual benchmarks lead to conclusions that are often challenging to unwind.
The Market vs The Benchmark
We should be clear that “the market” and “a benchmark” are not the same thing. Markets are dynamic ecosystems in which transactions clear based on a buyer and a seller – and multiple buyers and sellers often choose to transact at different prices based on various preferences. While the average price of a gallon of gas may be $3.00, there’s often that station that’s always cheaper, and of course there’s that station close to the highway that always charges a bit more. The value of a given company's common stock can vary notably within a given day or week, even though the company hasn’t changed and no new information about the company's future prospects is available. Those varying prices are based on different buyers and sellers choosing to transact differently.
The labor market works similarly – there is no one price or benchmark that is always true. The market for talent is even more dynamic than gas or stocks. The U.S. labor market is comprised of millions of workers, each with their own set of values and work preferences, and those preferences can change. As a result, we have to reflect that dynamic nature when we assess if an organization may need to compete differently for talent.
As we think about broader ways to assess competitiveness we must remember the goal of compensation – to attract and retain talent. Our search for data to help inform if there is a gap in compensation should start with an assessment of the two market transactions that can occur: hiring, and exiting.
We must also not forget that compensation is an investment – it often represents the largest expense a company incurs. Even when other indicators of a compensation problem exist, we have to understand the business context and expected return on incremental compensation.
A Broader View of Compensation Competitiveness
We suggest a four part review to assess market competitiveness and determine if an additional investment is the right decision:
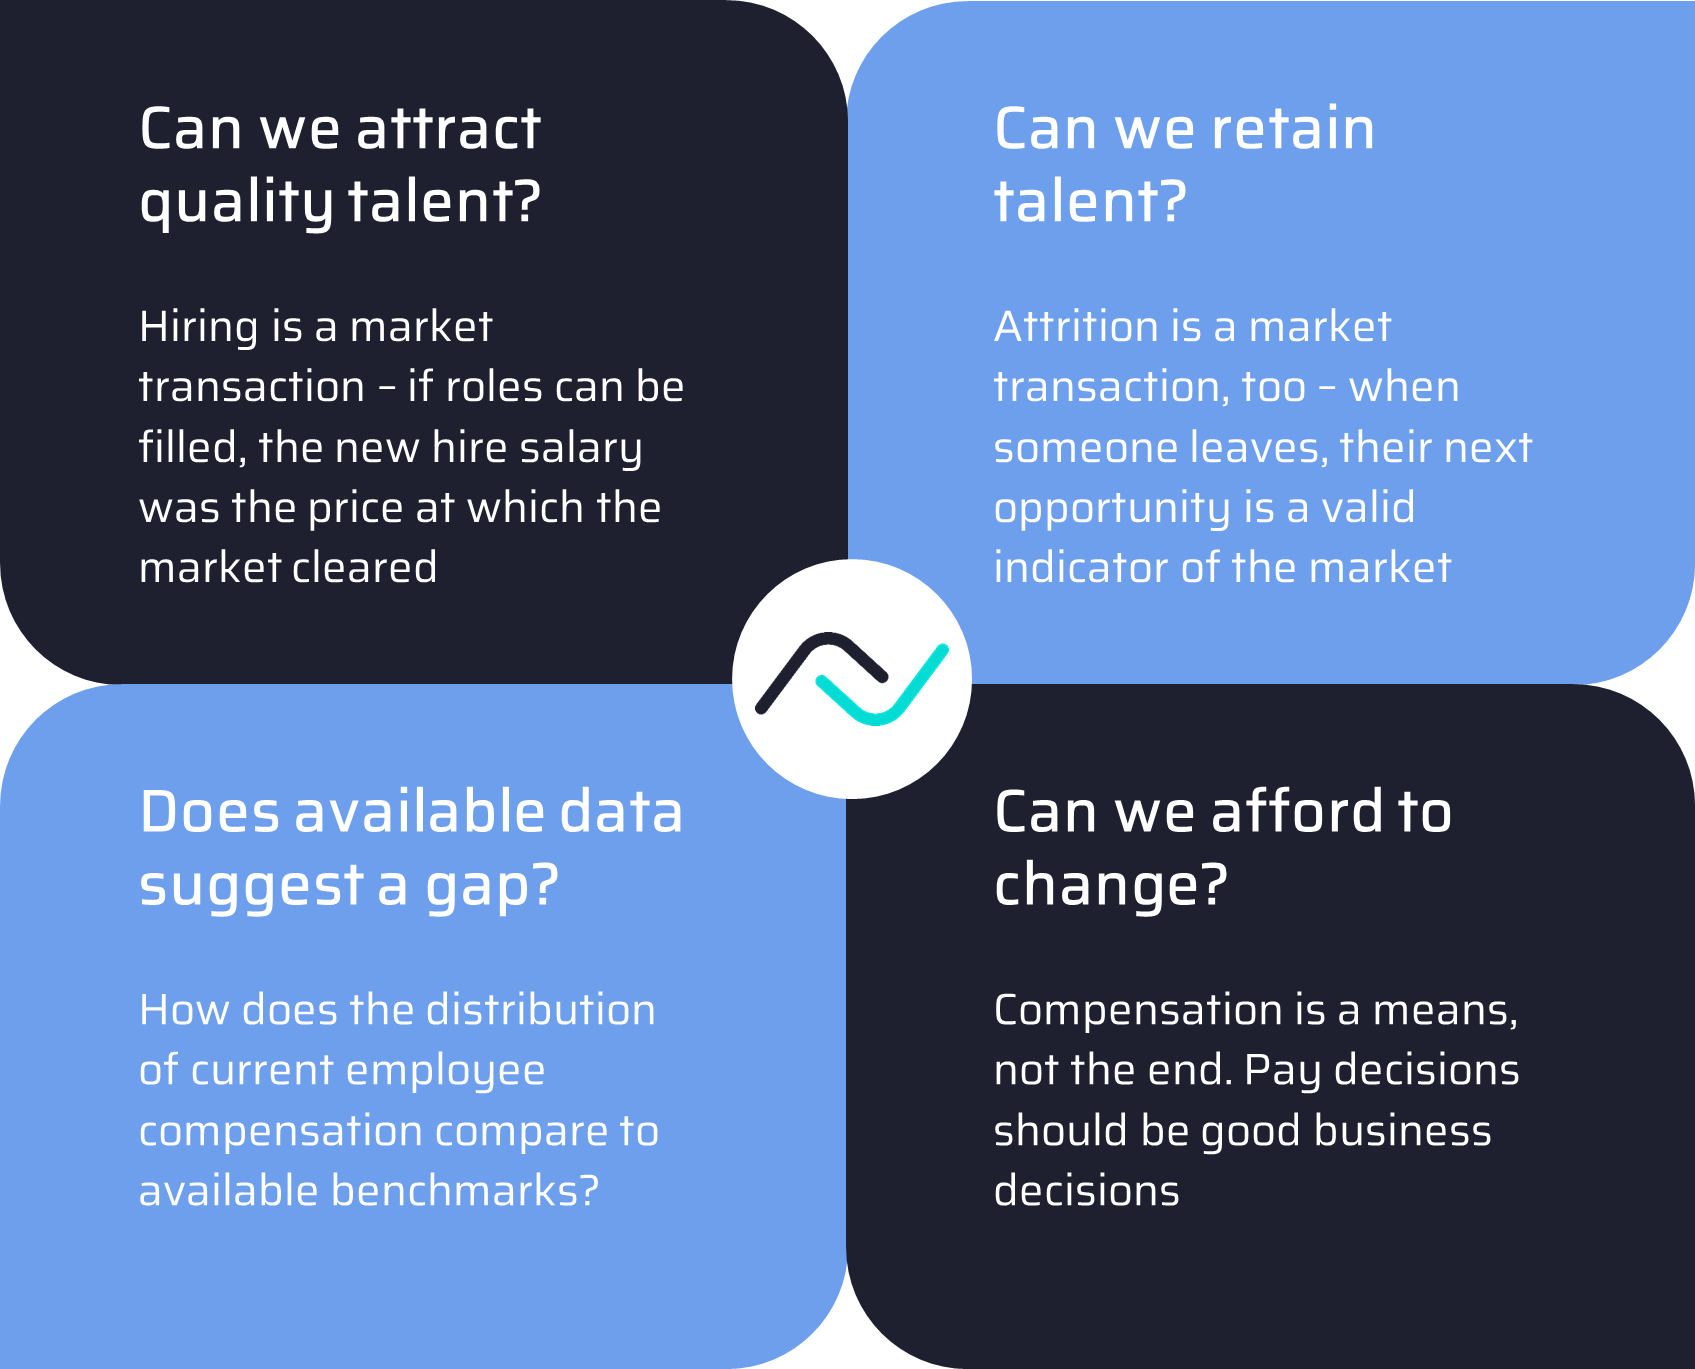
For each of these parts, we can identify a set of measures or observations that can support a more wholistic diagnosis of pay competitiveness.
Can We Attract Quality Talent?
There are plentiful metrics available associated with the talent acquisition cycle that can indicate pressures on compensation competitiveness. Note that no single measure is sufficient, and both the absolute value of each measure or a degree of change in any measure can be informative.
| Metric | Metric Calculation | Potential Concerning Indicators |
| Offer Acceptance Rate | Offers Accepted / Offers Extended | Low or declining acceptance rates |
| Time to Fill | Days Elapsed From Recruitment Start to Offer Accepted | Lengthening cycles to close roles |
| Candidate Decline Reason Rate | Offers Declined Due to Compensation / Total Offers Declined | Abnormally high or increasing rates |
| New Hire Comparatio | New Salary Salary / Salary Midpoint | Above 1.0, or higher than current employee comparatio, or an increasing new hire comparatio |
| 12-Month Retention | Percent of New Hires Reaching 12-Months Tenure | Low or declining retention |
| New Hire Success | Percent of Hires who reach 18 months tenure AND not lower performers | Low or declining rates |
** Looking for benchmarks on these metrics? If so, check out our Novo Compare service offering **
Can We Retain Talent?
The set of data here is rather simple: are you retaining talent. All companies should be measuring attrition, and all attrition should be segmented as voluntary/involuntary and regrettable/non-regrettable. If voluntary, non-regrettable attrition increases, that is an expensive problem and investment alternatives should be considered.
Increasing attrition does not always signal a compensation gap, of course. We recommend all companies conduct a confidential exit survey that gathers more insight into why an employee is leaving, which may reveal broader drivers of attrition that require attention. In many cases, other attrition drivers require less investment and thus can offer a more meaningful ROI.
If your organization is relying upon manager or HR interviews to determine the causes of attrition, we recommend you consider our Novo Retain service offering to remove bias from your feedback gathering.
Does Available Data Suggest a Gap?
This is where most explorations start - look at the benchmarks. In addition to compensation surveys, we also recommend understanding what other data points suggest:
- Applicant Expectations: Use any data gathered through candidate screening surveys to understand what it takes to attract applicant.
- Competitive Postings: Review the ranges or compensation rates shared by your competitors, given state-level pay transparency laws that require disclosure.
- Publicly Available Self-Reported Data: While this is not generally a high quality benchmark, it is one that shapes candidate expectations (and the data is getting better over time).
In addition to these job-level benchmarks, we also recommend evaluating your comparatio for new hires relative to more tenured employees. This can suggest if the market has moved materially in a short period of time.
Can We Afford to Change?
While this part of the review is not a diagnostic tool indicating whether you have a problem, it is an important lens to indicate if you can afford to use compensation as a solution. One company we worked with saw pressure on hiring sales talent, but sales costs as a percent of revenue were already about 2x most competitors. Adding more investment to an already over-invested area would not be a wise business decision, absent clear evidence that more pay would unlock more productivity.
A metric we use to assess the expected ROI of a compensation change is what we call MAIN: the Minimum Attrition Improvement Needed. The concept here is to compare the investment being made in compensation relative to the cost of attrition for the role. Consider an example where an organization is evaluating investing $3 million in a job family with 500 employees ($6,000 per employee). Assume that job family has 20% attrition (100 per year) and the cost of attrition is $50,000 per employee, which suggests an annual cost of attrition of $5 million. For the $3 million compensation investment to add value, it needs to save $3 million in attrition costs, which is 60% of its annual attrition cost. The MAIN is 60% - anything less than a 60% improvement in attrition (in this example from 20% to 8%, which sounds unlikely) would actually degrade value.
Conclusion
Most of the metrics above are readily available to most organizations, and can lead to a more robust discussion about investments in compensation. It's time to add more data to the discussion and rely less on anecdotal data- and yes, even rely less on compensation surveys - to judge where investments might be needed.
As you hit reply on Andrew’s email, you know your response won’t end the debate immediately.
Andrew, I appreciate your feedback and sourcing some additional data on market practices. We’ve added those data points to our reference benchmarks, which we can certainly discuss at our upcoming Compensation Business Review. When we holistically review our data on hiring, attrition, benchmarks and cost of sale, we have seen a pattern that suggests we’re still an attractive place to work and we get the talent we need to hit our goals.
Stepping back from benchmarks is an important part of making better compensation investment decisions. Rewards teams need to start gathering and understanding these broader metrics to ensure there is the right data on table when pay increases are being considered and prioritized.