
Understanding your new hire ramp period can help you better target new hire protections, manage performance, and find the right activities to manage during the ramp period. Here's a data-driven approach to evaluating your ramp period that gets beyond leader anecdotes.
As organizations hire new sales talent, whether it's in a growth phase or to backfill for attrition, it is understood that new talent is typically less productive than existing team members. Whether that's driven by new customers to meet, new products to understand, new internal systems to learn, or simply due to a bare pipeline, new hire performance tends to be lower than average.
But for how long?
It's an important question to consider for multiple reasons:
- Lower sales productivity needs to be built into the capacity plan and overall revenue forecast
- New hire earnings support programs, like lower quotas, guarantees, or draws, are an additive cost to the organization and would ideally only last as long as necessary
- Performance management programs that seek to identify under-performing representatives need to understand what standard of performance makes sense
Across industries and our clients, we've seen and heard of new hire ramp-up periods as short as one month (a transactional, inbound, inside sales role in the communications industry) and as long as 24 months (a strategic account manager in the long-cycle government contracting space). Most organizations fall somewhere in between, with common answers being 6 months or a year. But there is a big difference between those two durations, with significant consequences for organization profitability.
Understanding the new hire ramp-up period requires a careful evaluation of readily available sales performance data, as described in the three-step process below.
Step 1. Understand the rate of achievement over tenure
The first step involves using actual data to calculate/visualize how performance evolves over the course of a new representative's tenure. The chart below is an example, coming from a sales force in the software industry.
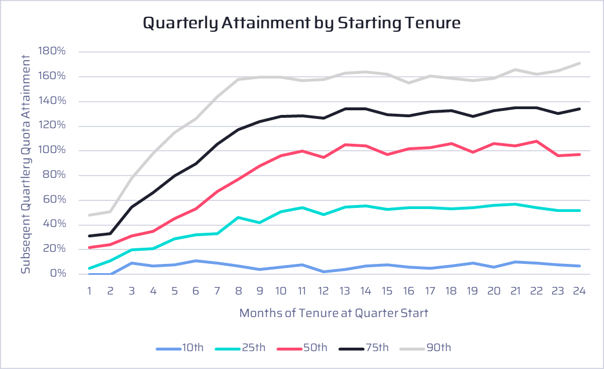
In this analysis, every quarter of performance over an available time horizon is analyzed as a discrete unit, with quarters categorized based on the tenure of the rep at the beginning of the quarter. Within a given group (e.g., quarters where the tenure of the rep was 0-1 month), we calculate the distribution of goal attainment and then plot those percentiles in a series.
In the example above, you can observe the following:
- Median performance ramps up over the first 10 months of tenure, then stabilizes with some normal volatility
- Top performance ramps up faster, reaching a stabilization point around 8 months of tenure
- Low performance is always there - the 10th percentile never materially increases
The key insight is that the distribution of rep performance starts to look "typical" once you reach around 10 months of tenure, suggesting that results prior to that point should be viewed as falling along the ramp period. Given that the performance levels above are in the quarter following that tenure point, the chart above suggests a 4-quarter ramp period, with 3 quarters of expected lower performance and a 4th quarter of near-normal productivity.
Why does this matter?
Some organizations fall prey to over-simplified views. In the example above, one could falsely presume that since a meaningful number of reps are reaching quota by month 7 the ramp-up period is only two quarters long. Since new hires tend to be spread out among teams, managers can also develop views of the ramp-up period that are biased by the reps they happen to manage. Evaluating the full set of new hires provides a more reliable, data-driven view.
Step 2. Understand the persistence of under-performance
The first step evaluated the period of time during which the performance distribution is not typical, and showed that low performance tends to always be present regardless of tenure. What that view does not evaluate, however, is the extent to which low performance tends to persist. In many cases, an individual may have a bad quarter but then may show greatly improved performance in subsequent quarters. The opposite can also be true, as early success can be followed by a period of underperformance.
The example below comes from a large sales organization in the life sciences industry. This graphic compares performance in one period (along the horizontal axis) to performance in the next period (vertical axis). Shading has been added to identify segments of the population worth understanding further.
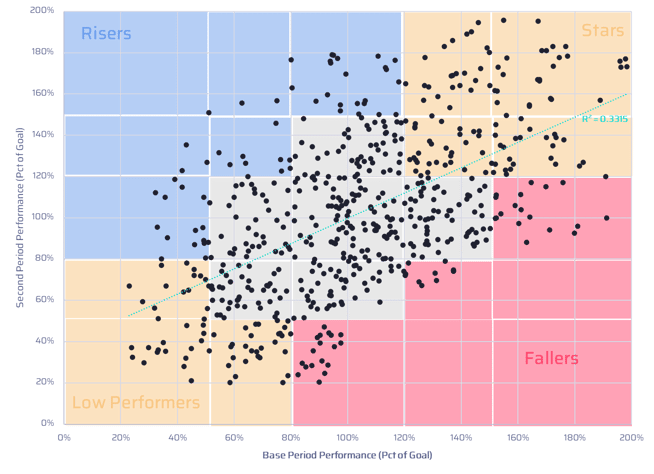
In this example, performance in one period is correlated to performance in the next period: there is an upward right trend in the plot, and the trendline indicates some degree of significance to the relationship. But there are material outliers - in this case, 17% of representatives had a significant change in performance from one period to the next (identified as "Risers" or "Fallers" in the graphic). 15% of those below quota in the first period exceeded quota in the second period, and a similar percentage of those above quota in the base period fell below quota in the second period.
This analysis can be simplified, which is particularly helpful for smaller organizations, by evaluating the proportion of representatives with material performance swings, from high to low or from low to high. For example, one organization found that among sales reps exceeding quota in a given year, 45% of those same reps fell below quota in the following year. Similarly, they found that of the sales reps falling below quota in a given year, about 40% of those reps exceeded quota the following year.
Why does this matter?
While the distribution of performance may not normalize until a certain degree of ensure, it's important to remember that individuals may or may not experience a smooth ramp-up period. The example above suggests that even tenured representatives have swings in performance: relatively few reps are consistently stars. Performance volatility occurs, and understanding the degree of volatility can inform how to interpret performance over the ramp-up period.
Step 3. Understand which underlying metrics are predictive of long-term performance and when they become predictive
Waiting for the ramp-up period to end and then observing multiple periods to see if solid/high performance can be sustained incurs a lot of cost and leaves too much to chance. Leading sales organizations actively monitor and manage performance through the ramp-up period to maximize the likelihood a representative succeeds.
We find, however, that many organizations fail to have a clear view of how to evaluate contributions early in the ramp-up cycle. If a new rep closes a sale quickly, does that mean they are on a path to success? Does pipeline build suggest long-term sustainable success? Do certain activities drive later results?
All could be true - so we suggest a quantitative review of key metrics to see what early signs become predictive of longer-term performance. Our recommended methods vary depending on the data available, with methods including segmented mean comparisons, decision tree prediction analytics, or multiple regression. In all cases, we build a dataset that articulates the longer-term view of sales rep performance (e.g., performance in years 2 and beyond), and then use data from their first few quarters to see what, if anything, was predictive of longer-term success.
The example below illustrates the findings from one sales force, where we used a decision tree learning machine learning algorithm to identify early predictors of longer-term performance.
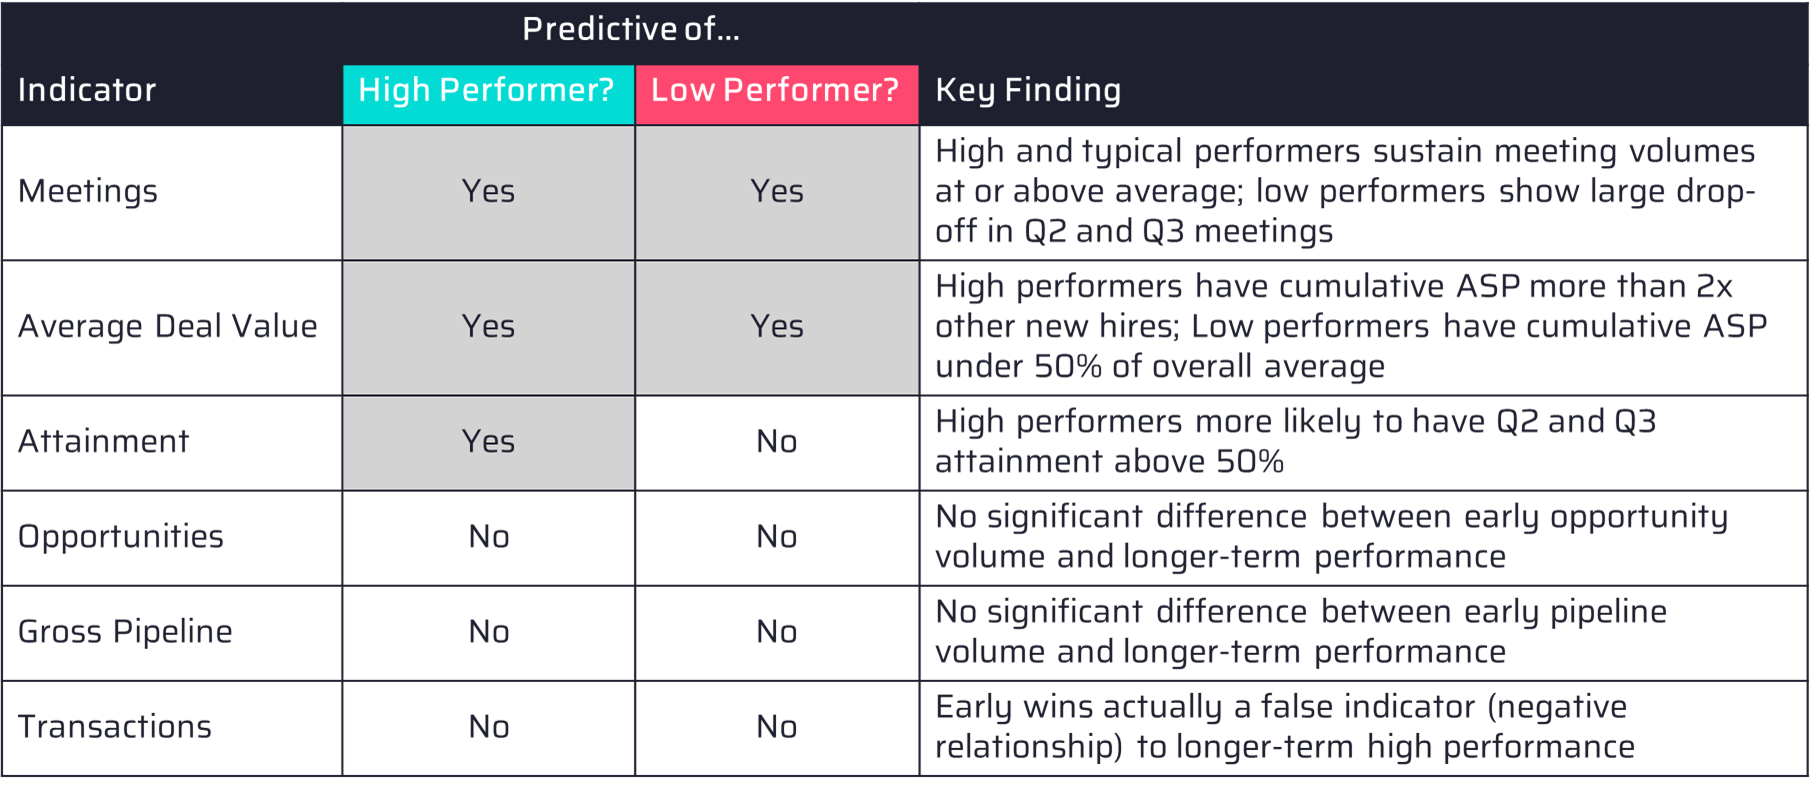
In the example above, note that the number of early transactions (in this the count of deals closed) was not predictive of longer-term performance. In fact, a higher number of early wins was actually a negative correlate with longer-term high performance - a situation where biases can form around early success that turns out being unsustainable.
Also in this example, in no circumstances were activities or results form the first quarter predictive of long-term performance. All metrics required a cumulative view of performance through at least two quarters, if not three, to generate a meaningful view of rep performance potential.
Why does this matter?
Using data to quantify what is likely to predict longer-term success (of failure) can help an organization better identify how to enable new talent and manage performance. Managers are prone to watch for early wins, which may be more the result of territory composition or luck than it is of underlying success traits. In many cases, metrics that exhibit strong sales tactics, like sustainable meeting generation or demonstrating value through price discipline, can be better leveraged to improve the chances of ultimate success.
Understanding the new hire ramp-up period and what metrics are strong indicators of longer-term performance can identify potential improvements in your onboarding and enablement strategy. Whether that's more optimal new hire support programs or changes to the structure of compensation, a review of the ramp-up period can create a meaningful impact on sales effectiveness.
We can use the data you have to better understand your sales force.
Novo Insights uses best-in-class analytical tools and methods, coupled with decades of experience evaluating sales performance, to help identify opportunities to improve sales productivity and decrease the cost of sales.