
If there is one buzz phrase we’ve heard a lot in HR and Rewards circles, it is “pay for performance.” We like to apply it in all sorts of scenarios – commission design, consideration of piece-rate pay systems, merit systems, even health care management. We love the idea rewarding those who are producing, both as an incentive to produce but also as a way to drive a more variable cost structure that aligns with value created.
Unfortunately, we find that People leaders can be a bit myopic about pay for performance. We define performance at a point in time, and judge the quality of how we are paying for performance based on how a pay decision we just made compares to that point in time view of performance. How do commission payouts compare to quota achievement this year? To what extent did salary increases in this cycle compare to our recent talent review scores? What have you done for me lately to earn this bonus?
If our pay systems are so nearsighted, can we really be that shocked when employees start thinking more nearsighted about their careers and job choices?
When we become nearsighted, we also tend to put so much pressure on every decision to get pay for performance “right” every time. Every salary increase cycle needs to look right… every bonus payout must be differentiated based on performance… every stock grant should only go to those performing. Those are great goals, but they force us to lose perspective about other aspects of employee contributions and risk that are worth aligning with rewards.
We need to take lengthen our perspective
A few years ago we were asked to evaluate the effectiveness of a company’s pay system, specifically being asked if it did a good job of aligning pay and performance. That’s a pretty broad question, and ultimately we agreed to focus the question more specifically: To what extent is target cash compensation growth aligned with performance over time?
There are a few subtle but important things to note about this refined question. We narrowed the scope to target cash compensation only, which in this company was a good proxy for “pay” for about 90% of employees. Salary and target cash incentives are pay components that employees typically understand and equate with future-looking opportunity, rather than actual bonuses/commissions which are backward-looking. We agreed to exclude stock awards, as only a limited set of leaders were eligible.
By agreeing to look at things “over time” it allowed us to eliminate some of the noise in the data that occurs at any one point of time, like that random market correction for one person, or that new hire that came in very high compared to peers.
A key methodology assumption was made to focus the analysis on employees who had been at the company for a full three years. That’s a big assumption, but in this environment worked given relatively modest attrition. Since the goal was to evaluate the effectiveness of the “system” around pay, it also has the benefit of quantifying the impact on the type of people the company wanted – meaning those that want to stick around. The logic here is to take a same store sales view to see how your pay decisions affect people.
In itself, that is a metric worth knowing.
Comparable Employee Pay Progression (CEPP) = The rate of compensation growth for a defined set of employees over time.
We all love to lament a 3% merit pool, but you’ll find your comparable employee pay progression to exceed 3% in most years. People get promoted, ad hoc adjustments occur… and it adds up.
Back to the story.
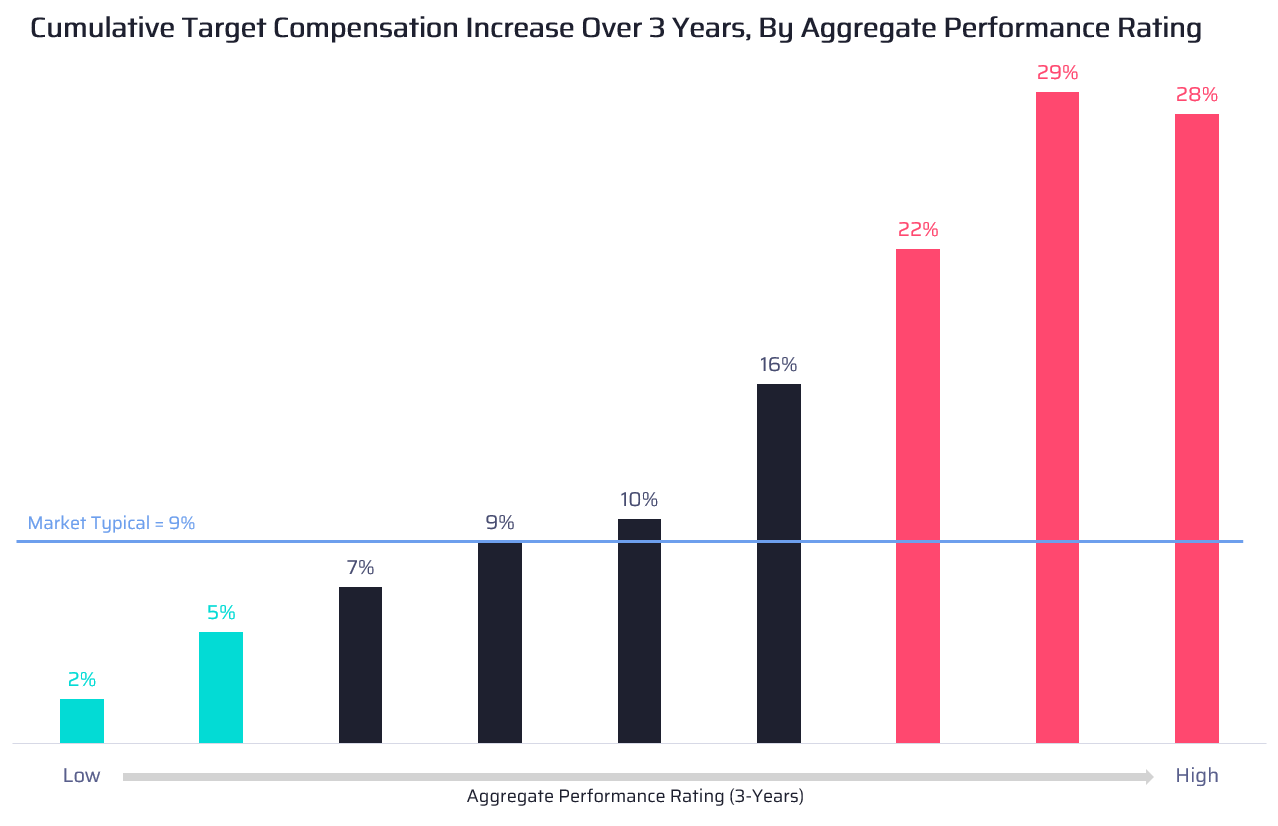
To understand the effectiveness of the pay system at rewarding performance, we wanted to look at the Comparable Employee Pay Progression for the three year window, but segmented by employee performance. Defining performance can be tricky, and this company was in the process of moving away from a traditional 5-point performance rating scale. But they hadn’t moved yet, and we agreed that while there were flaws in the rating system the sum of ratings over the three year horizon would be a reasonable proxy for employee performance. Somebody who gets a 5 every year is likely a better contributor than someone who gets a 3 every year. Someone who got two 5s and a 4 probably isn’t that different than someone who got all 5s, though. Overall, looking at segments (high performers had a sum of 13 or better, low performers had a sum of 8 or less, and everyone else is in the middle segment) can give a glimpse into how pay progression compared.
The chart below illustrates the findings. The color shading of the bars indicate the performance segment, and the X-Axis labels (the actual performance sum) were removed to de-emphasize a focus on that. The values indicate the Comparable Employee Pay Progression for the employees in that performance segment. We added a reference line at 9%, which was what someone would have received if they got a “pool average” raise through the annual merit process each year.
It’s important to note that the pay system did not explicitly link to performance ratings. Of course there was guidance to “pay for performance” but there was no diversion of funding toward high ratings, nor was there a limitation on what increases could occur given a rating. So all of this happened relatively naturally within the pay system.
In fact, most of the differentiation happened through job movement. Great performers were more likely to get a promotion which generated an out-sized compensation adjustment. Had we just looked at the annual merit process, these employees might be less differentiated (since they often wouldn’t get another raise on top of the big adjustment they just received upon promotion). But overall, the pay system was rewarding top talent.
The Big Idea
The key takeaways are this:
- Think about pay for performance with a longer perspective. Be less myopic.
- Understand the difference between Comparable Employee Pay Progression and other popular descriptions of pay growth.
- Worry less about minor differences in performance and focus more in performance segments. There is a lot of noise in performance data, and zooming out to broader groups eliminates some noise.
Taking a different view might open new possibilities for how you approach specific programs and decisions. The compensation function is ready to change, and widening our view of what we’ve been doing might help us understand where to go next.